It's super easy to embed a monitoring entry into your Confluence page. Just open the custom macro editor by searching for “Service Monitoring' in the macro search.
The custom macro editor let's you choose to create or choose an existing monitoring entry to embed.
Create a monitoring entry
The same set of forms as in Configure Services is used. After creating the monitoring entry, you can continue with the macro configuration.
Choose an existing monitoring entry
Search the list for the monitoring entry, you want to embed.
Click “embed” to proceed with the configuration.
Configure the macro
With these options you can adjust the macro to fit your needs:
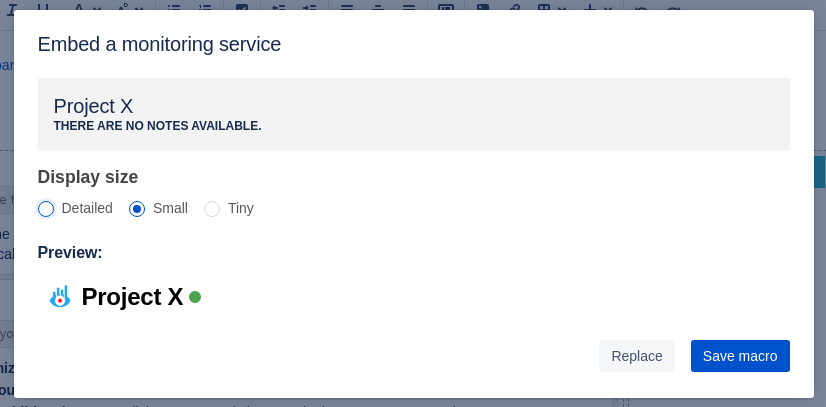
Display mode
Detailed:
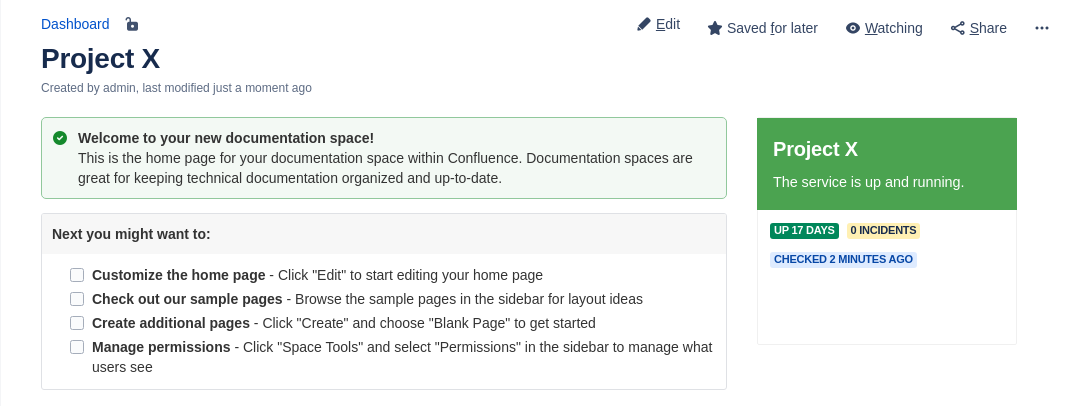
Renders a card of the service just as for an entry in the dashboard. Indicates the status by red/green color of the card header. The card has useful information such as the current uptime. If there is an open incident you can directly inspect it by opening a modal.
Reduced:
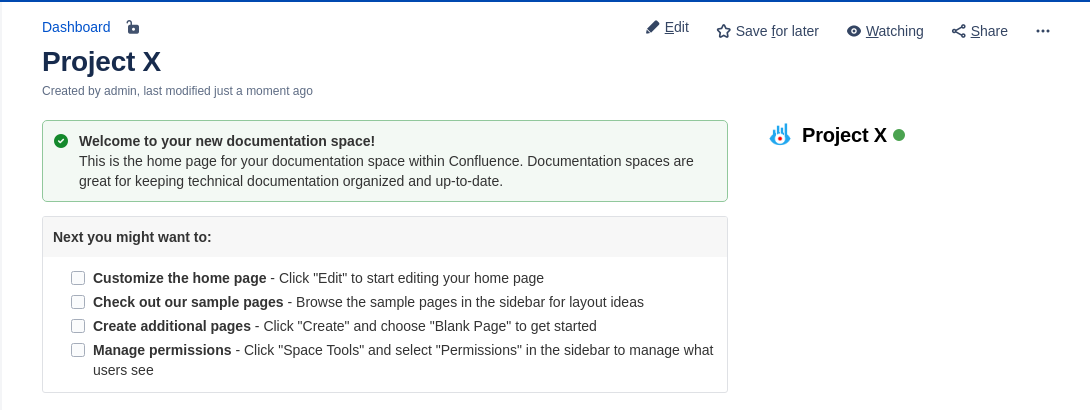
Renders the name of the service and a small bubble indicating the status by red/green color.
Minimal:
Only a small bubble indicating the status by red/green color.
